
Samsung Hylex — Omnichannel Product Marketing
Reversing Q4 Sales Decline, $612k Revenue in 3 Weeks

BEFORE

AFTER
$612K+
Revenue Generated(in 3 weeks)
277%
YoY Sales Growth (for Q4 W3 - W5)
40%
B2B Email Open Rate(vs. 22% Industry Avg.)
18.5x
Sales Velocity (for Q4: 8%→147.62%)
YOY Q4 Revenue
“Saw this post today on LinkedIn, it’s really great! Thank you for repurposing Samsung’s national ads/case study into a message that resonates so well with your local market. Great idea!! Fantastic work!!”

This campaign generated $612,756 in new revenue in 3 weeks, achieving 147.62% YoY growth and significantly outperforming industry benchmarks.
Challenge
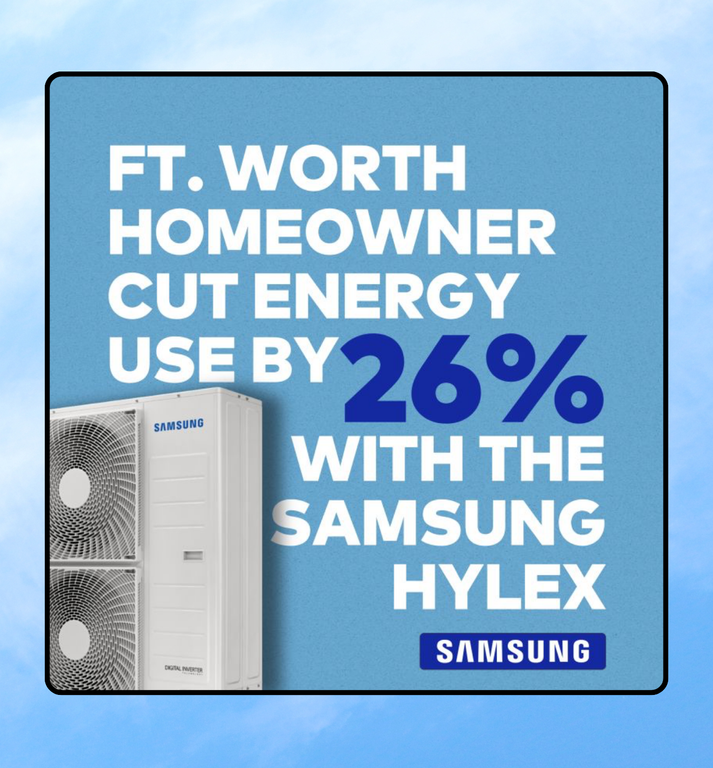
The HVAC industry expects a 15% sales decline in Q4 due to seasonal demand. To combat this multi-year seasonal trend, I transformed Samsung’s technical case study into a high-impact, value-centric campaign.
Strategy & Solutions
AI-Generated Content Transformation: Developed and leveraged data-informed user personas with AI to transform Samsung’s technical case study into value-centric, segmented ad copy for different audiences.
Multi-channel Orchestration: Designed and executed a unified campaign across Email, LinkedIn, Facebook, and E-commerce banners, ensuring cohesive messaging focused on energy efficiency and cost savings.
Performance Optimization: Segmented email campaigns via Mailchimp and A/B tested subject lines to achieve peak engagement.

B2B Email Marketing
Social Media Analytics
